Fractals, Power Laws, and Wall Street
07-13-2025·7 min read
Introduction
When I was in elementary school growing up, our Art class had a whole "unit" on snowflakes. We were taught that each snowflake is unique and were shown a few cool looking ones on the whiteboard. But as 3rd graders that was the extent of our interest on the matter. It turns out, however, that snowflakes are actually pretty cool. A fractal is any class of complex geometric shapes that contain a fractal dimension. These dimensions are characterized by self-similarity, or the property where component parts resemble the whole. In layman's terms, each part of each part, when magnified, will look like a fixed-part of the whole object. Perhaps the most famous fractal is the Mandelbrot set, discovered by Benoit Mandelbrot (more on him later): 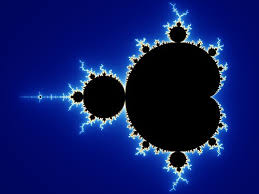 If you haven't seen this before, you should check it out. It gets a little trippy, but the coolest part is that this is all math. In fact, the fractal dimension is expressed as a non-integer number. The Snowflake Curve is a great example of this. Consisting of three different parts, each of which is made of four different scaled-down parts of the whole, Helge von KochSwedish mathematician known for pioneering fractal understanding was able to derive the fractal dimension. Intuitively, we have a scaling factor of Since each broken down component is one-third of the previous whole and after scaling we are supposed to see four repeated components:
Thus, the fractal dimension of the snowflake Curve is 1.26An interesting interpretation of the value of the fractal dimension is that it is an indicator of the complexity of a figure. This is cool and all, but you may be wondering: "Does this have any real-world use or are these things just cool shapes?"
Fractals Applied: Power Laws
To examine the true power that Fractals possess, we need to examine power laws. At its core, a power law is a relationship where a relative change in one quantity gives rise to a proportional relative change in another quantity. The general form of the power law equation is: . While it might sound and/or look simple, it does have some interesting implications. Zipf's law is one such implication, where it states that the frequency, , of a word is inversely-proportional to its rank, , in the frequency tableOr how many times it is used compared to all of the other words in the language. So let's say the most common word is used times in a given instance, here is what we can derive based on power laws:
So, the second-most frequent word appears times, the third-most frequent word appears times, and so on. This is cool and all, but we still don't know what the exponent term really means. In the example of above it is just 1, which seems inconsequential. Here is what is interesting: the exponent actually reveals a lot of information about the underlying structure of the system. Different exponents tell us about the scaling behavior, or how the system responds when we change the scale of measurement. In fact, the same power law relationship appears across completely unrelated phenomena. When dealing with fractal structures in particular, we can construct a unified equation that combines fractals and power laws. This process lies in the log-log relationship of the general power law equation.
Through this transformation, we can plot the data and see the scaling behavior as a straight line, where the slope directly gives us the scaling exponent. As a corollary, this reveals that power laws possess scale invariance, or the fact that the same patterns repeat at different scales. When we express this relationship as a self-similar function A(x) here is not necessarily a fractal, but a function that describes some property of a fractal:
This is known as the scaling equation, where is a constant factor and is the scaling component. When analyzing fractal structures with this framework, the scaling component becomes the fractal dimension, directly linking the geometric properties of fractals with its mathematical scaling behavior. The connection arises because both the scaling component and the fractal dimension represent the same thing: how the content of a structure scales when we change our measurement scale. The ultimate goal with this framework is to find the scaling component, , enabling scale-agnostic analysis of fractals.
From Theory to Reality: Fractals on Wall Street
So far we've explored the mathematics behind fractals and power laws, but here's the real question: where does this actually matter in the real world? The answer lies in one of the most complex systems on Earth—financial markets. And it turns out, the properties of fractals make them a seemingly perfect fit for market analysis:
- Patterns emerge at many different scales in markets - strategies can be based on long-term signals or just microseconds
- Extreme events that happen in markets are considered to be normal scaling behavior for fractals - market crashes follow the same pattern as daily movements
- Fractals capture how simple trader interactions create complex market-wide patterns - individual positions affect the system-wide trends
As you can see, fractals are more than just theory and cool shapes. Benoit Mandelbrot was the first to assert the value of fractals in financial markets all the way back in 1963. He initially challenged the commonly held belief that market returns live on a normal distribution. Instead, he argued, "extreme" events are much more common than the empirical rule would suggest. Perhaps his most famous quote describes a key part of fractal theory: "large changes tend to be followed by large changes, of either sign, and small changes tend to be followed by small changes"This is known as volatility clustering. Since this model is scale-agnostic, there is no difference between an extreme event on a scale of a few seconds compared to one on a scale of a few weeks. Thus, to some extent, large shifts in price or market properties are simply just part of how it works as a complex system.
Let's take a look at a case study: the 2008 Financial Crisis. Traditional models would never have guessed (and didn't) that such a devastating event could even occur. By the nature of normal distributions, the 2008 Financial Crisis was borderline impossible. The difference isn't small, traditional models predicted the 2008 crisis had roughly a in chance of occurring while fractal models showed such events happen with much higher probability. But what if we take a view through the lens of fractal theory? We see extreme events all the time in the finance world. That is, only if you are aware of the scale. Most of these extreme events are on such a small scale that traditional models aren't even aware that they happen. However, with the notion of self-similarity, the fractal model recognizes these events as extreme, whether it is a drop in price for a second or two or the 2008 Financial Crisis. The 2008 Financial Crisis isn't the only "fat tail" event to support fractal theory; other key events like the Dot-Com bubble are also used as strong evidence.
Understanding that crashes follow fractal patterns isn't just academic... it's profitable. Firms all around the world now leverage this methodology for profit in several ways. A very simple way it is used is by looking for patterns on very short-term time horizons. Once something is found, traders are able to lean on fractal theory to understand how these patterns may play out on longer time horizons. Another interesting tool comes in the form of fractal technical indicators, like the Bill Williams Fractals indicator, which are based on the idea that certain patterns always show up before price movements. Finally, and arguably the most important use-case of fractal theory is involved in risk management, where it is used to prevent loss from extremely "rare" events. Of course, not everything is sunshine and rainbows, and fractal theory does have its imperfections. Namely, its heavy reliance on historical data, imperfect self-similarity in the complex system that is the market, and overall difficulty when it comes to finding and deciphering patterns.